
SHT40 · POWER DESIGN
SHT40 Power Consumption: Measurement Modes, Heater Current and Battery Life
From 0.08 µA idle current to a 100 mA maximum heater-on current, with mode-by-mode comparisons, an editable 3.3 V power budget and a PCB validation sequence.
The SHT40 combines low-power temperature and humidity measurement with an integrated heater. A useful power budget separates two questions:
Energy over timeHow much does the sensor add to the average load and battery budget?
Peak currentWhat must the supply deliver during a measurement or heater pulse?
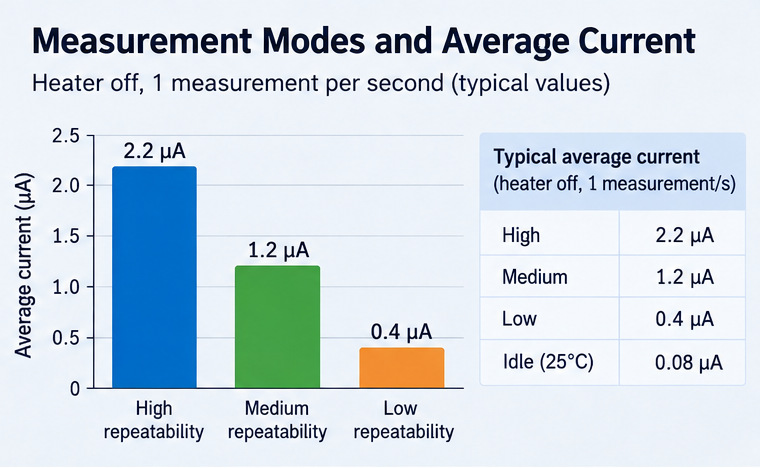
Typical average supply current Heater off · one measurement per second
A heater event can briefly draw current in the milliampere range. Even with a very low average load, the supply voltage may drop at heater startup.
The guide works through a 3.3 V, sensor-only example and an illustrative system-level battery budget. Device specifications come from Sensirion's SHT4x datasheet; calculated planning estimates are identified separately.
1. SHT40 power consumption at a glance
| Operating condition | Typical current | Maximum listed current | Interpretation |
|---|---|---|---|
| Idle, at 25°C | 0.08 µA | 1.0 µA | Sensor powered but not converting |
| Active measurement | 320 µA | 500 µA | Instantaneous conversion current |
| High repeatability, 1 measurement/s | 2.2 µA average | Not specified | Conversion plus idle time |
| Medium repeatability, 1 measurement/s | 1.2 µA average | Not specified | Conversion plus idle time |
| Low repeatability, 1 measurement/s | 0.4 µA average | Not specified | Conversion plus idle time |
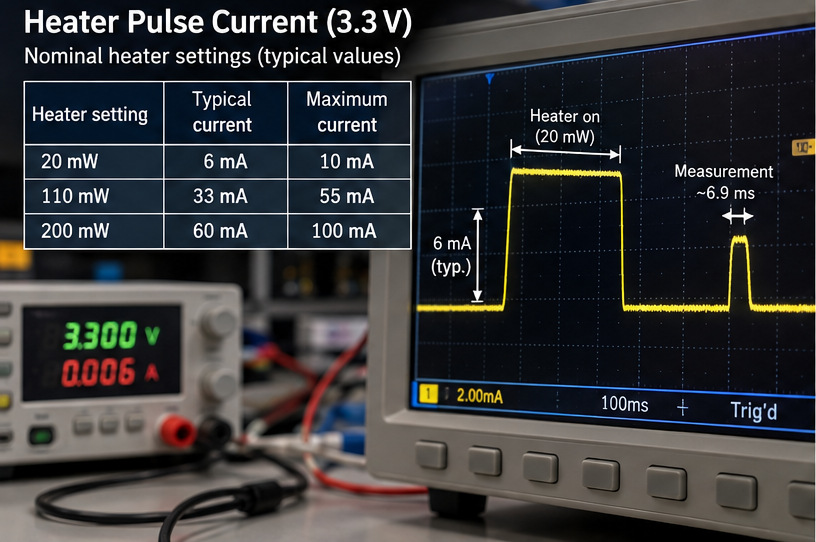
| Heater, nominal 20 mW at 3.3 V | 6 mA | 10 mA | Heater-on supply current |
| Heater, nominal 110 mW at 3.3 V | 33 mA | 55 mA | Heater-on supply current |
| Heater, nominal 200 mW at 3.3 V | 60 mA | 100 mA | Heater-on supply current |
Source: SHT4x datasheet, Table 4. The published current values are specified for the SHT4x family and particular operating conditions; do not read typical averages as guaranteed maxima.
The bare SHT4x sensor operates over a 1.08–3.6 V supply range. Do not connect the bare sensor directly to a 5 V supply. Some third-party breakout boards tolerate higher external voltages because they incorporate power-conditioning circuitry; the board's specification is not the bare sensor's rating.
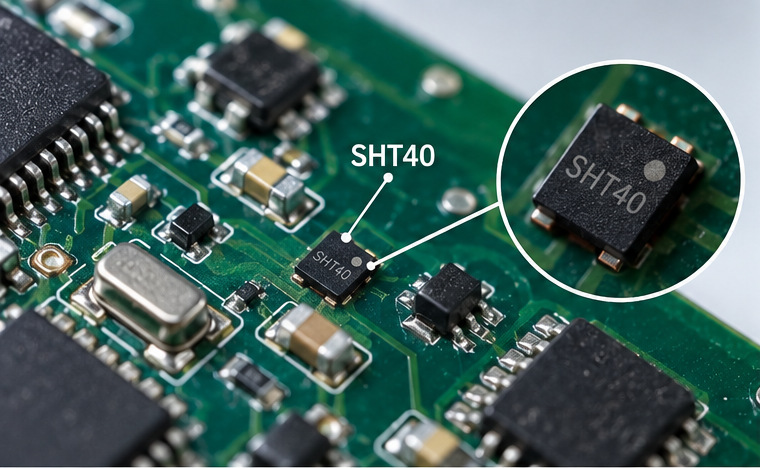
2. Measurement modes: noise, conversion time and current
The device provides three single-shot repeatability modes. High repeatability reduces measurement noise but takes longer to convert; low repeatability has a shorter conversion and lower average current. The output's repeatability is not interchangeable with its absolute accuracy specification.
| Mode | I²C command | Typical conversion duration | Typical average at 1 Hz |
|---|---|---|---|
| High | 0xFD |
6.9 ms | 2.2 µA |
| Medium | 0xF6 |
3.7 ms | 1.2 µA |
| Low | 0xE0 |
1.3 ms | 0.4 µA |
A slow-changing room-temperature display may need a new reading every ten seconds, not every second. But the proper interval depends on control requirements, environmental change rate, noise tolerance and whether readings are used for alarming or feedback. Choose the longest acceptable interval and lowest acceptable repeatability for the actual application.
3. Estimate average current without ignoring idle consumption
Assume the sensor stays powered between samples and each measurement uses approximately the same charge. Split the continuous idle current from the incremental measurement contribution:
I_base ≈ I_idle + (I_1Hz − I_idle) × f / (1 Hz)
Here f is the requested measurement frequency; I_1Hz is the manufacturer-reported typical average at 1 measurement/s. This equation extrapolates rounded typical values, so it is a planning model rather than a guaranteed specification over all voltages, temperatures and sample rates.
For high repeatability at one sample every 10 seconds, f = 0.1 Hz:
I_base ≈ 0.08 + (2.2 − 0.08) × 0.1
= 0.292 µA
| Repeatability | Datasheet typical at 1 Hz | Estimated at 0.1 Hz, heater off |
|---|---|---|
| High | 2.2 µA | 0.292 µA |
| Medium | 1.2 µA | 0.192 µA |
| Low | 0.4 µA | 0.112 µA |
Directly dividing 2.2 µA by ten would incorrectly scale down the idle current as well. The displayed precision clarifies the model's arithmetic and does not imply metrology-grade accuracy.
The estimates are sensor-only and exclude host wakeups, communications, bus resistors, regulator losses and PCB leakage.
4. Heater peak current and pulse duration
The integrated heater has three nominal settings at 3.3 V: 20, 110 and 200 mW. Short and long heater commands nominally operate for 0.1 s and 1 s. Heater labels do not imply constant wattage at other supply voltages.
| Nominal setting | Typical heater-on current | Maximum specified current |
|---|---|---|
| 20 mW | 6 mA | 10 mA |
| 110 mW | 33 mA | 55 mA |
| 200 mW | 60 mA | 100 mA |
The specified short-pulse heater interval is 90–110 ms, typically 100 ms; the long interval is 0.9–1.1 s, typically 1.0 s. Under heater commands, the sensor performs a high-repeatability conversion as part of the command sequence. Refer to datasheet Table 5 and Section 4.9 for the timer/conversion behavior.
The datasheet limits heater operation to less than 10% duty cycle, requires ambient temperature below 65°C for heating, and specifies that sensor temperature must not exceed 125°C. Normal accuracy specifications do not apply during heater operation. Do not treat a heated reading as ambient temperature or RH without thermal recovery verification.
5. Worked example: a short heater event every ten minutes
Model inputs Illustrative
- Sensor supply
- 3.3 V
- Normal sampling
- High repeatability · every 10 s
- Heater command
- 20 mW short pulse · every 600 s
- Typical heater-on current
- 6 mA
The heater and conversion phases draw different currents. The datasheet specifies a 0.09–0.11 s short heater interval; the values above use typical timing, not measured pulse lengths.
1 Normal measurement baseline
One sample every 10 seconds is 0.1 Hz. Keep the 0.08 µA idle current while scaling the measurement contribution from the 1 Hz typical average.
I_base ≈ 0.08 + (2.2 − 0.08) × 0.1
= 0.292 µA
2 Add one heater command every 600 seconds
Apply 6,000 µA only to heater-on time, then 320 µA to the following high-repeatability conversion. Subtract idle current from both phases because it is already in the baseline.
I_event,extra ≈ [(6,000 − 0.08) × 0.100
+ (320 − 0.08) × 0.0069] / 600
= 1.004 µA
0.292 + 1.004 = 1.296 µA3.3 V × 1.296 µAWhat the result means
- Charge per event
- 0.6022 mC ≈ 1.99 mJ at 3.3 V
- Heater-on duty fraction
- 0.0167% 0.100 s / 600 s
- Share of average current
- ≈ 77% from the heater command
The event charge uses 6 mA × 0.100 s + 0.320 mA × 0.0069 s = 0.6022 mC. Normal standalone readings and the heater-command measurement are separate scheduled events in this model; the conversion within the heater command is counted only once. If firmware omits or delays a normal sample during recovery, recalculate the average.
The heater interval is an energy-model input, not a validated condensation-control schedule. Measure the event waveform and charge on the assembled PCB before using the estimate for battery sizing.
6. How heater frequency changes consumption
Holding the sensor's 0.292 µA normal baseline and the same modeled short event:
| Heater schedule | Estimated heater increment | Estimated sensor average |
|---|---|---|
| Heater disabled | 0 µA | 0.292 µA |
| Once every 60 minutes | 0.167 µA | 0.459 µA |
| Once every 10 minutes | 1.004 µA | 1.296 µA |
| Once every 1 minute | 10.037 µA | 10.329 µA |
These are hypothetical current estimates, not validated environmental-control schedules. Heating frequency is a thermal and reliability decision as well as an energy decision. Recovery depends on enclosure, airflow, self-heating and mounting geometry. See Sensirion's integrated-heater application note.
7. Battery-life example: sensor current is not system current
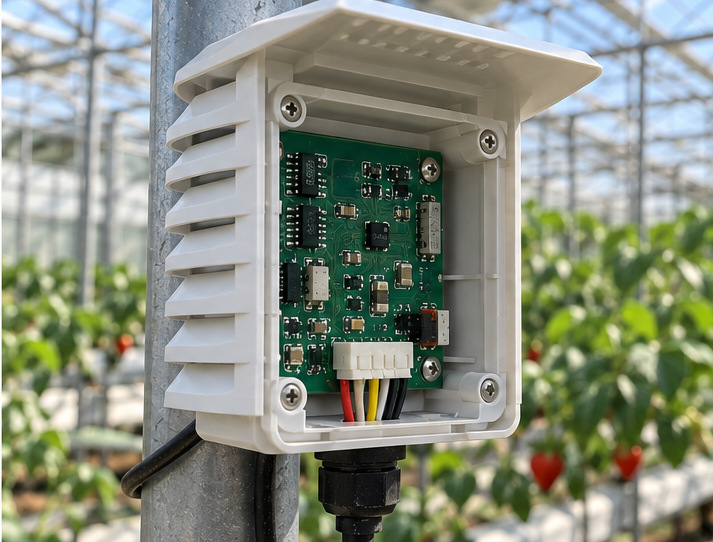
A low-power node also contains a processor, radio, I²C resistors, regulator and leakage paths. Consider an illustrative system where the rest of the circuitry averages 50 µA on the same 3.3 V rail. This is not a specification for an ESP32 or for a particular NYFEA board.
| Load | Illustrative average current |
|---|---|
| SHT40, including modeled heater events | 1.30 µA |
| Remaining circuitry | 50.00 µA |
| Total | 51.30 µA |
P_rail ≈ 3.3 V × 51.296 µA ≈ 169.3 µW
For a hypothetical battery with 1 Wh of usable energy and an assumed effective conversion efficiency of 85%, the idealized runtime is:
Runtime ≈ (1 Wh × 0.85) / 0.0001693 W ≈ 5,021 hours ≈ 209 days
This is not a guaranteed duration. Usable battery energy, self-discharge, temperature, source resistance, cutoff voltage, regulator operating mode and active radio transmissions can change runtime. Include upstream regulator quiescent current and standby losses if they are not captured by the assumed effective efficiency.
Switching from high to low repeatability at 0.1 Hz reduces the modeled normal sensor current by approximately 0.180 µA, but against 50 µA of other loads the reduction is only around 0.35% of the combined average. System-level decisions typically matter more than optimizing one sensor number.
Interactive SHT40 power-budget calculator
Adjust the assumptions below. Results are planning estimates only and do not establish a battery-runtime guarantee.
The model adds a 6.9 ms high-repeatability conversion at 320 µA typical after each heater pulse. Enter heater-on time only.
Typical-current planning estimate, not a worst-case specification.
8. Why a low-power sensor can still cause supply droop
A low average current does not guarantee a stable supply. A heater command can draw 6 mA typically at the 20 mW setting, while the 200 mW setting has a specified maximum of 100 mA. Battery resistance, connectors, traces and regulator response can pull the sensor rail down during the pulse.
ΔV ≈ ΔI × R_effectiveThis example isolates the resistive component; capacitance, regulator dynamics and simultaneous MCU or radio activity can change the measured waveform.
Prototype troubleshooting sequence
- Probe at the sensor.Measure SHT40 VDD during heater startup and record the minimum voltage.
- Capture the current pulse.Use enough bandwidth to see the brief heater event, including its peak.
- Check concurrent loads.Look for MCU or radio peaks occurring at the same time.
- Review the regulator.Check peak-current capability, transient response and quiescent operation.
- Trace the supply path.Inspect supply and return layout, capacitor placement, connectors and wiring.
- Repeat at the limits.Test at the lowest battery voltage and representative temperature and humidity extremes.
A capacitor may soften a transient. It cannot replace a source capable of delivering the required peak current and total energy.
9. How to validate the model on a real PCB
Measure the sensor in the intended circuit and environment. Capture full current and VDD traces, then compare the event charge and whole-system average with the planning model.
- Record the setupLog sensor ordering code, PCB revision, supply voltage, ambient RH and temperature, repeatability command, sampling interval and heater schedule.
- Measure idle currentKeep the sensor powered and the heater off, with no conversion in progress.
- Integrate conversion chargeCapture measurement current over the complete conversion interval; integrate the trace to obtain charge per reading.
- Integrate heater-event chargeRecord current and VDD together from before the command through the following conversion; note both peak current and minimum rail voltage.
- Calculate the cycle averageUse
I_avg = (1/T) × ∫ I(t) dtacross a representative interval, not a single steady-state display value. - Check recoveryWith the intended enclosure and airflow, establish when temperature and RH readings again represent the target ambient air.
- Measure the complete systemInclude MCU, radio, memory, regulator and other loads. If rails differ, compare power or energy rather than adding unlike currents.
Evidence to save with each test run
| Validation item | Evidence to record |
|---|---|
| Measurement mode and sampling interval | Firmware settings |
| Heater command, interval and state | Log or command capture |
| Peak event current | Waveform with sampling settings |
| Event charge | Integrated trace, µC or mC |
| Rail sag | VDD minimum at sensor pin |
| Average current | Whole-cycle measurement |
| Thermal recovery | Independent reference and defined criterion |
| Test method | Instrument, range, bandwidth and PCB revision |
Datasheet typical values are useful reference points. Validation data from the actual design are what ultimately determine reliability and battery runtime.
10. Practical SHT40 low-power design decisions
| Engineering observation | Most useful next action |
|---|---|
| Measurements are unnecessarily frequent | Reduce sample frequency within response-time requirements |
| Normal conversion noise is not critical | Consider medium or low repeatability |
| Heater dominates average current | Validate a less frequent heater schedule, if environmentally appropriate |
| Heater start resets the sensor | Investigate peak-current path and rail sag |
| Post-heater readings are biased | Establish temperature/RH recovery criteria |
| Battery runtime misses target | Measure every significant system state |
| Regulator dominates idle power | Compare realistic light-load efficiency and input quiescent current |
11. Frequently asked questions
How much current does the SHT40 consume?
Typical idle current is 0.08 µA at 25°C. With the heater off and one measurement per second, typical average current is 2.2 µA high, 1.2 µA medium and 0.4 µA low repeatability.
What current flows during a normal SHT40 conversion?
The datasheet lists 320 µA typical and 500 µA maximum during active measurement. These values are not the same as the average current at a low sampling rate.
How much current does the SHT40 heater use?
Typical heater-on currents are 6, 33 and 60 mA for nominal 20, 110 and 200 mW settings at 3.3 V. The respective maximum specified currents are 10, 55 and 100 mA.
What is the SHT40's lowest-power measurement setting?
Low repeatability offers the lowest typical average current at a fixed one-per-second measurement schedule. Reducing measurement frequency can further reduce sensor average, subject to the continuous idle component.
Can I use a coin cell with an SHT40?
Possibly, but a design must pass both energy capacity and peak-current/voltage-drop tests. In particular, heater pulses and other system loads may exceed what a particular cell can reliably support near end of life.
Does the SHT40 work from 5 V?
Not as a bare sensor: the specified SHT4x supply range is 1.08–3.6 V. A breakout board may accept a higher input only if its additional circuitry is designed for it.
Can I use SHT40 readings immediately after a heater event?
Not without validation. Heating alters the sensing element's thermal state; recovery to ambient depends on the hardware and environment.
How is SHT40 battery life calculated?
Measure or model whole-system average input power, convert usable battery energy to the corresponding energy at the load using realistic power-system behavior, and validate with the assembled design.
Is SHT40 power consumption negligible with ESP32?
Not necessarily. The sensor may have very low average consumption, but ESP32 firmware, radio activity, board peripherals and regulation often dominate the system budget. Measure the full board and use a separate article for the details of SHT40–ESP32 I²C wiring and code.
Final engineering takeaways
Average current determines long-term energy use; peak current determines what the supply must deliver during a transient. Both are essential to a sound SHT40 power budget.
For the explicitly stated 3.3 V example—high-repeatability readings every 10 seconds and a modeled 20 mW short heater event every 600 seconds—the calculated sensor average is approximately 1.30 µA, corresponding to 4.28 µW. That is a model, not a test result or guarantee.
Prior to release, replace the assumed heater-event charge with a measurement from the assembled PCB; validate source voltage, environmental recovery, complete-system average and the battery's usable input energy under intended conditions.
Sources and calculation disclosure
- Sensirion — SHT4x Datasheet, Version 7.3 (June 2026). Tables 4 and 5; Section 4.9.
- Sensirion — Using the Integrated Heater of SHT4x in High-Humidity Environments.
Example inputs: 3.3 V rail, one high-repeatability reading every 10 seconds, one nominal 20 mW short heater command every 600 seconds, 50 µA for the remaining rail load, 1 Wh usable battery energy and 85% effective conversion efficiency. All calculated currents and runtimes above derive from these assumptions; they are not additional manufacturer specifications.